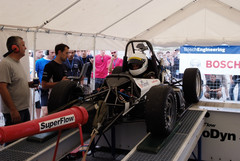
Again in 2008 Bosch Engineering GmbH sponsored the “Best dynamometer performance award” and covered the expense of having a chassis dyno at the competition site. All teams that passed technical inspection were able to compete for the award by performing a power measurement on the dyno. The team with the highest corrected power output measured at the wheels was granted the award.
There are multiple reasons that only maximum power was taken in consideration and not like some teams had requested maximum torque and even the entire torque/power curves. The main reason is that the transmission type is not specified in the rules. Would every team be required to run a transmission with fixed gear ratios, it would be possible to consider comparing torque/power curves. But teams could also run a continuously variable transmission (CVT) where the engine speed stays constant at all times during acceleration. With this type of transmission only a single torque/power point measurement could be performed and a comparison to a torque/power curve from a car with fixed gear ratios would not be possible.
Another reason is that in order to really get a correct torque/power curve the exact engine speed must be known to the dyno computer. The type of engine management system vary so much that it would be impossible to get a correct reading from all cars. So what we do on the dyno is to synchronize the engine speed based on the speed of dyno roller at single point in the correct gear. This allows us to measure torque/power curves with a limited accuracy, not taking wheel slip into consideration.
This year the <link teams all-known-teams team-details tid _blank>Technical University of Darmstadt took home the price with a maximum power output of 70.2 kW (95.5hp). In second place the <link teams all-known-teams team-details tid _blank>FHTW Berlin came in with 69.1 kW (94.0hp). Tied for third place were the <link teams all-known-teams team-details tid _blank>University of Stuttgart, the <link teams all-known-teams team-details tid _blank>Technical University of Graz and the <link teams all-known-teams team-details tid _blank>University of Karlsruhe with each 67.8 kW (92.2 hp).
Overall the performance of all measured teams shows a high level of competitiveness and proves how serious teams go about optimizing their engine packages. The owner and operator of the dyno Mr. Köhler stated that he and his team were quite impressed with the improvement of the performance of just about every team they measured. “The majority of the engines were running very smoothly”, he stated.
In total 29 cars were tested on the dyno and about 120 dyno measurements have been performed at the 2008 event.
Upon request from a lot of teams we are again publishing the measurement data taken. The data includes corrected power and torque (DIN and ECE corrected) output of the best dyno pull for each team.
Place | Car No. | University | EWG [kW] | EWG [hp] |
1 | 6 | TU Darmstadt | 70,2 | 95,5 |
2 | 14 | FHTW Berlin | 69,1 | 94,0 |
3 | 1 | Uni Stuttgart | 67,8 | 92,2 |
3 | 2 | TU Graz | 67,8 | 92,2 |
3 | 10 | Uni Karlsruhe | 67,8 | 92,2 |
4 | 18 | Aalborg | 67,7 | 92,1 |
5 | 65 | Wiesbaden | 67,1 | 91,3 |
6 | 53 | Kiel | 67,0 | 91,1 |
7 | 97 | Schweinfurt | 66,9 | 91,0 |
8 | 90 | Köln | 65,6 | 89,2 |
9 | 96 | Zwickau | 64,9 | 88,3 |
10 | 16 | Uni Padova | 64,8 | 88,1 |
11 | 3 | FH Graz | 61,9 | 84,2 |
12 | 67 | Osnabrück | 59,2 | 80,5 |
13 | 4 | Helsinki | 59,1 | 80,4 |
14 | 80 | TU Berlin | 58,3 | 79,3 |
15 | 25 | Ravensburg | 56,8 | 77,2 |
16 | 40 | Eindhoven | 56,0 | 76,2 |
17 | 99 | HS Karlsruhe | 55,8 | 75,9 |
18 | 64 | Kaiserslautern | 54,8 | 74,5 |
19 | 35 | Wolfenbüttel | 47,6 | 64,7 |
20 | 32 | Mittweida | 45,6 | 62,0 |
21 | 67 | Freiberg | 45,2 | 61,5 |
22 | 78 | Montreal | 40,3 | 54,8 |
23 | 8 | Oxford | 37,1 | 50,5 |
24 | 85 | Delft | 36,3 | 49,4 |
25 | 77 | Tokyo | 35,3 | 48,0 |
26 | 72 | HSU Hamburg | 29,6 | 40,3 |
27 | 58 | Nevers | 16,0 | 21,8 |


